This post demonstrates how to use the pycensuskr package to analyze Korean census data.
Installation
You can install pycensuskr via pip:
pip install pycensuskr
Basic Usage
Here is a basic example of how to load census data and district boundaries.
from pycensuskr import CensusKRfrom matplotlib import pyplot as pltimport geopandas as gpd# Create a CensusData instancecensus = CensusKR()# load specific year data (e.g., 2020)# This returns a dictionary containing various census datasetsdata_2020 = census.load_data(2020)print(data_2020.keys())# load district boundaries for a specific yeardistricts_2020 = census.load_districts(2020)print(districts_2020.head())
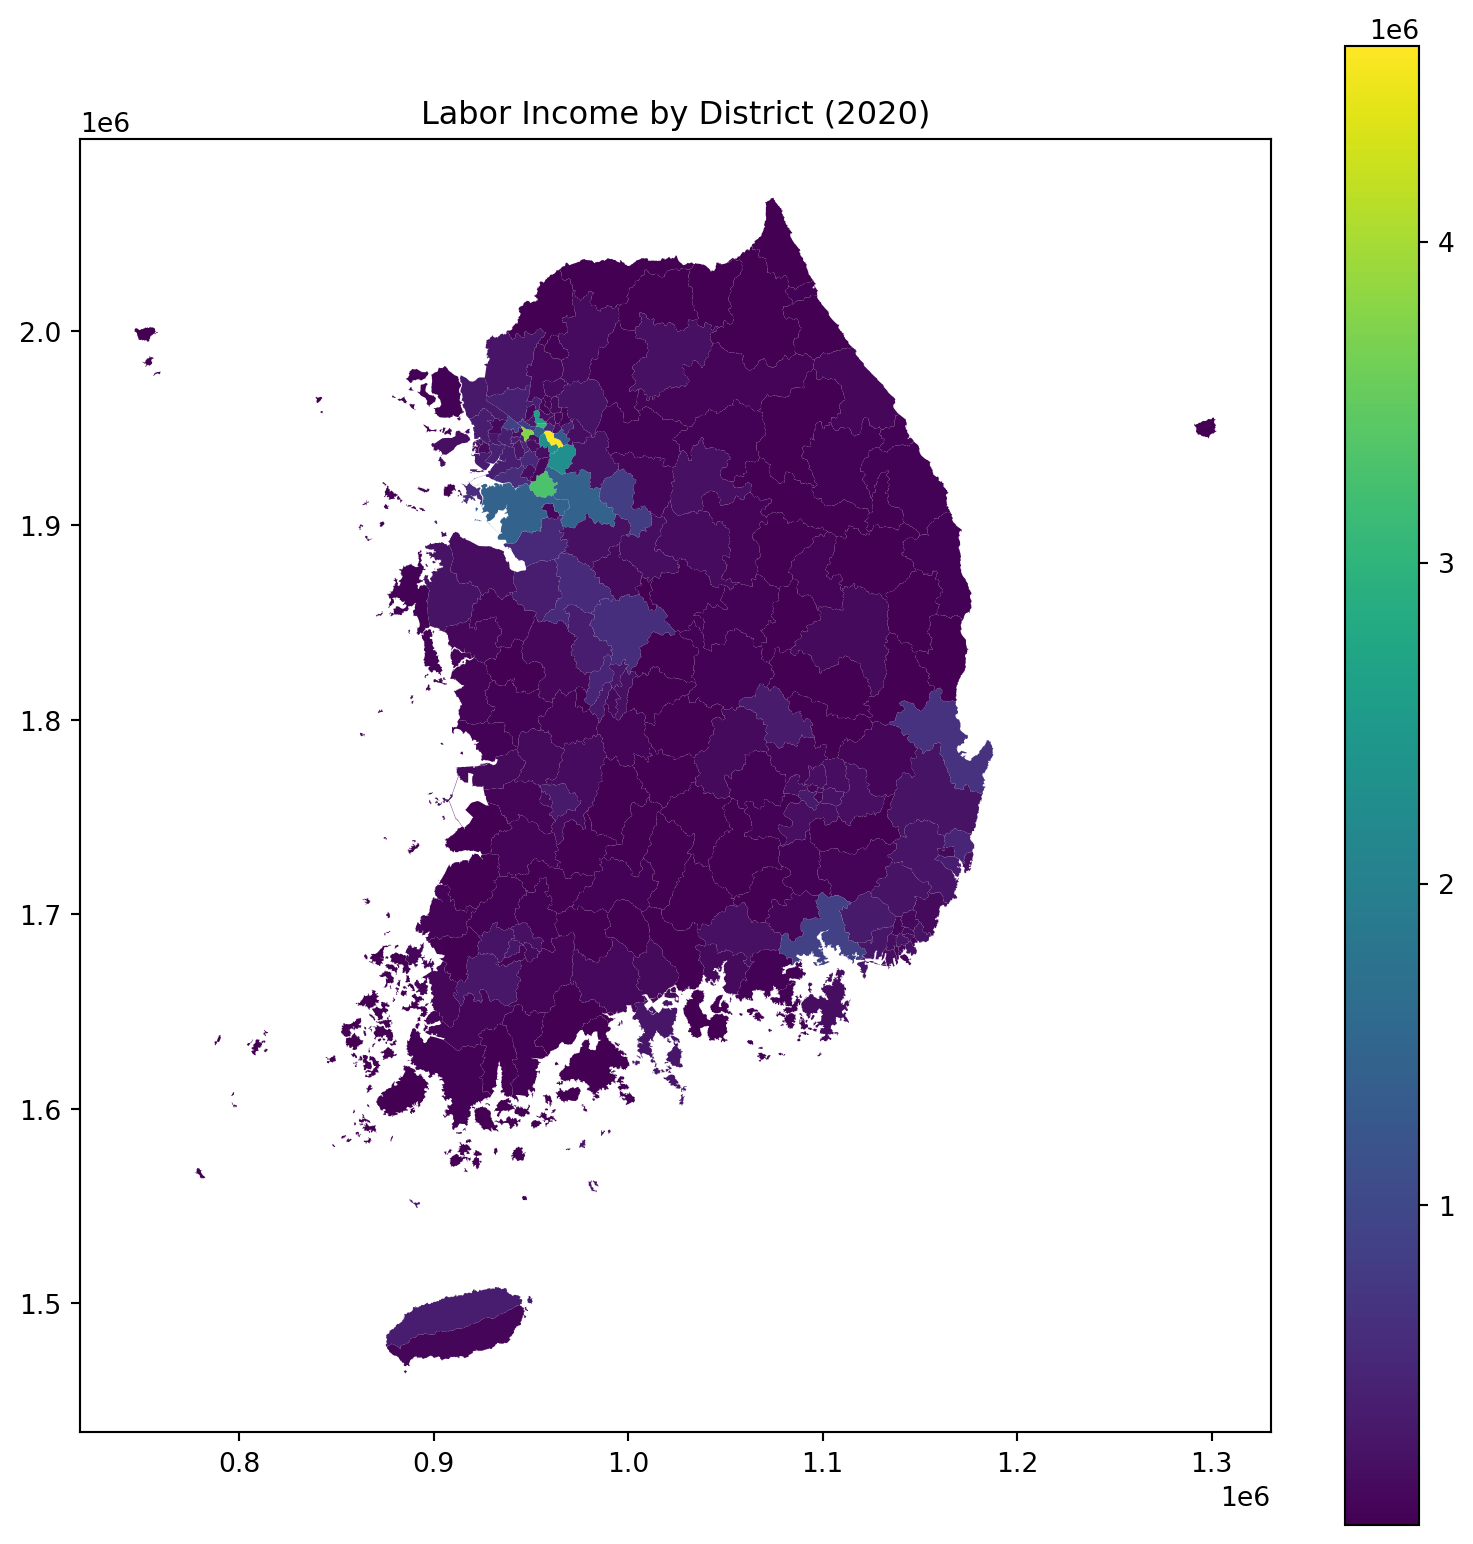
# Example: Process and visualize tax data# First, basic processing of district codes to match data aggregation leveldistricts_2020["adm2_re"] = districts_2020["adm2_code"].astype(str).str.slice(0,4)# aggregate geometries by adm2_redistricts_2020 = districts_2020.dissolve(by="adm2_re", as_index=False)districts_2020["adm2_code"] = districts_2020["adm2_re"] +"0"districts_2020["adm2_code"] = districts_2020["adm2_code"].astype(int)# Retrieve tax datadf_tax_2020 = census.anycensus(year =2020, type="tax", aggregator ="sum")# Merge spatial data with tax datadistricts_tax_2020 = districts_2020.merge(df_tax_2020, on="adm2_code")# Plot labor incomedistricts_tax_2020.plot("income_labor_mil", legend=True, figsize=(10, 10))plt.title("Labor Income by District (2020)")plt.show()